From Raw Data to Real Insight:
At GapBridge Institute, we often tell our students: Data is only powerful when you can explain it.
This week, Cohort #4 proved exactly that.
What began as a small classroom dataset of just six respondents turned into a fully structured statistical report — complete with tables, figures, interpretation, and practical recommendations. The assignment may have been labeled “for learning purposes,” but the execution reflected real-world analytical standards.
The Challenge
In Assignment 3.1 for the course STATA – Data Management, Analysis and Visualization, students were asked to:
- Organize raw survey data
- Generate frequency tables
- Compute percentages
- Visualize findings
- Interpret patterns
- Write a professional statistical report
No copy-paste outputs.
No software code dumps.
Just clear analysis and meaningful storytelling with numbers.
The Transformation
Using a simple cross-sectional dataset (N=6), the student explored:
- Gender distribution
- Textbook availability
- Access to a quiet study environment
- Access to extra lessons
On the surface, these are basic variables. But the power lies in interpretation.
Instead of merely reporting numbers, the student translated them into insight:
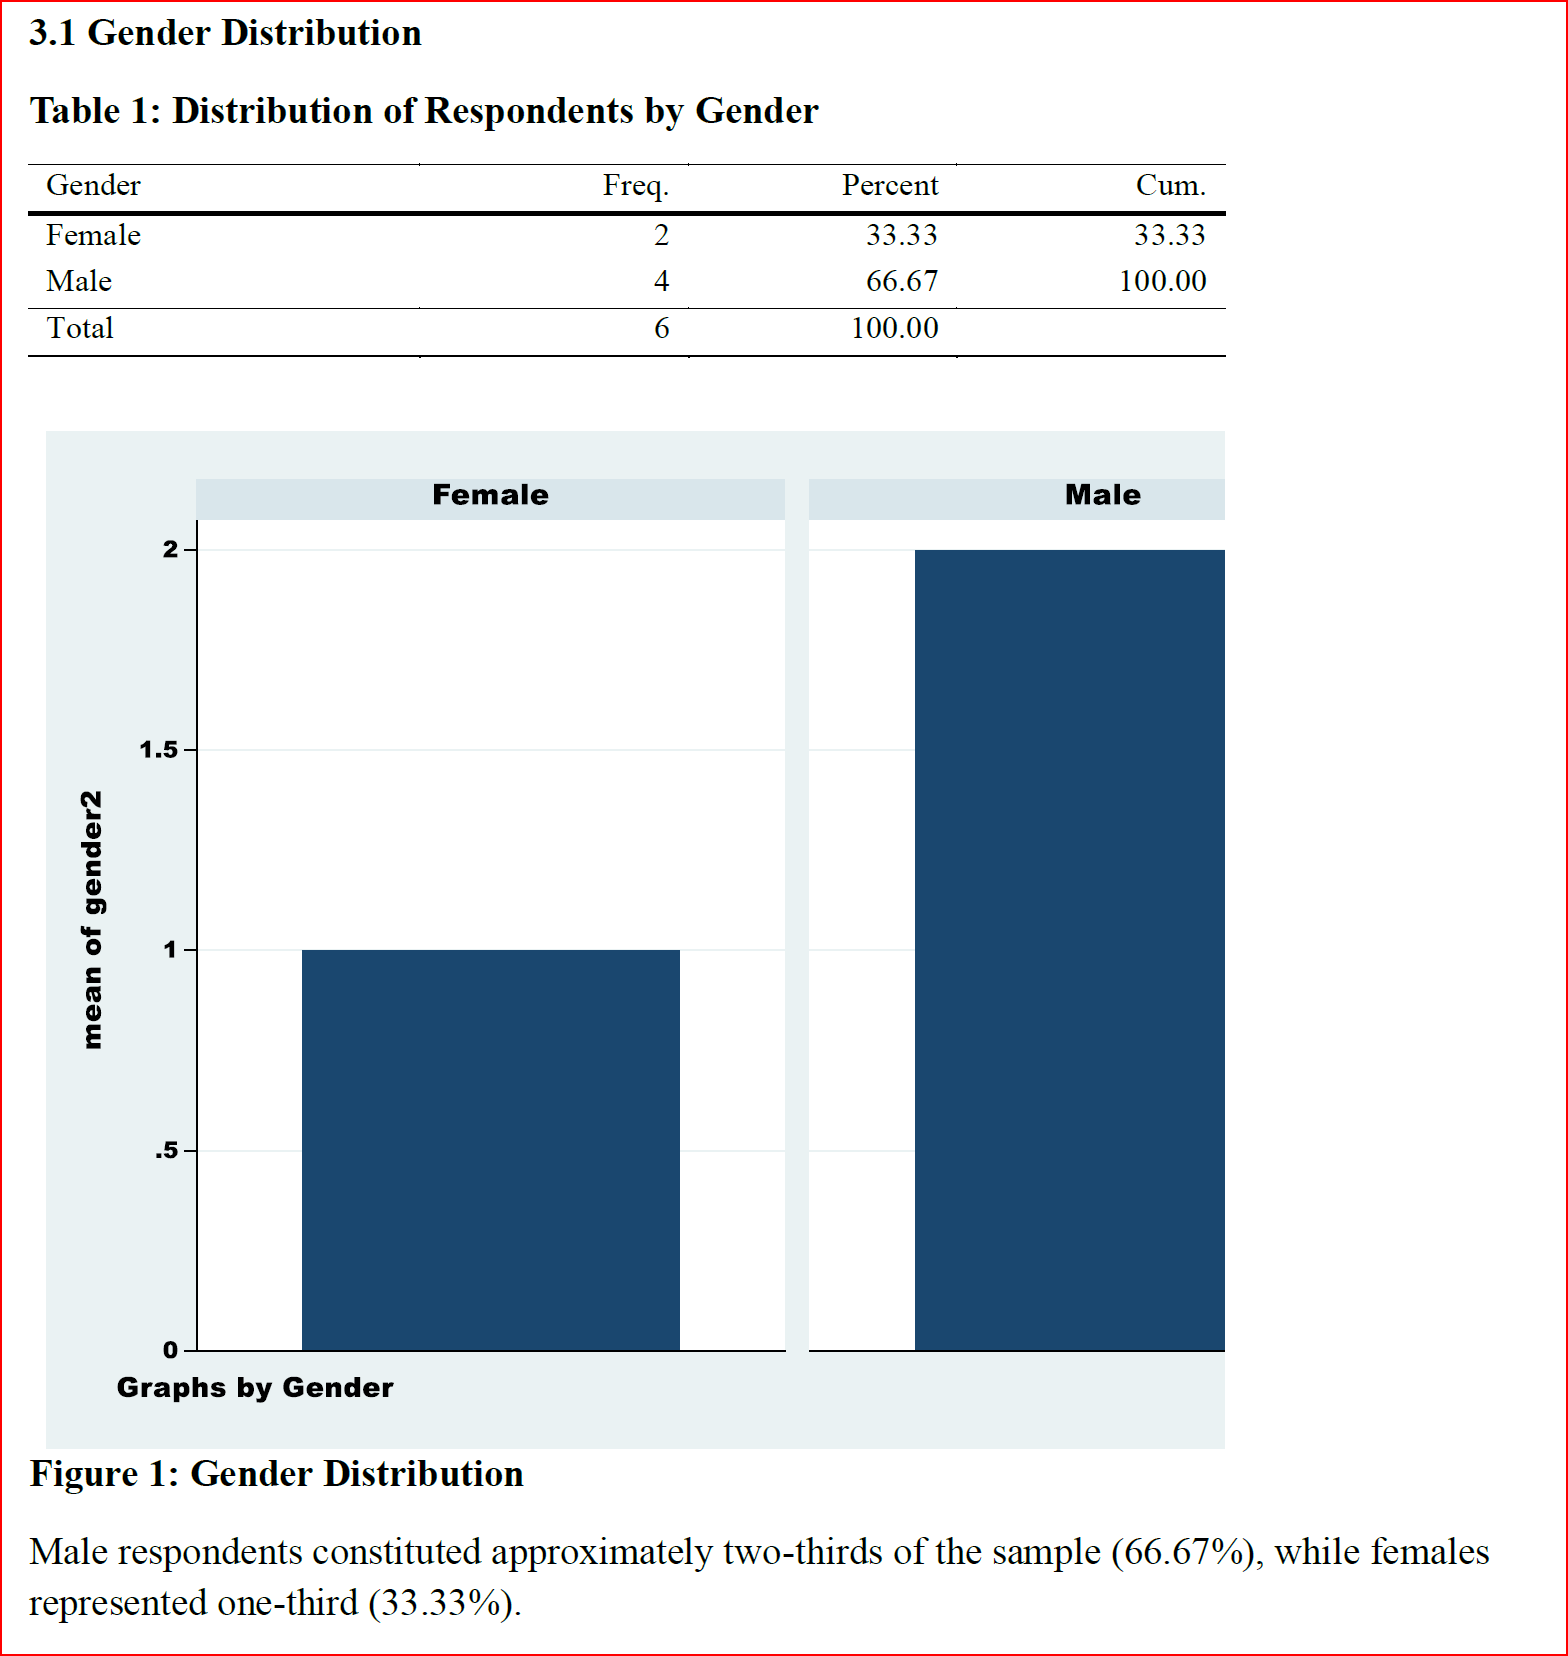
- Two-thirds of respondents were male.
- Most students reported adequate textbook access.
- Study environment conditions were evenly split — revealing a potential equity issue.
- A majority received extra academic support through tutoring.
And importantly — the student clearly stated that findings from a small sample cannot be generalized.
That single sentence demonstrates statistical maturity.
Why This Matters
In many institutions, students learn how to run commands.
At GapBridge Institute, students learn how to:
✔ Think statistically
✔ Communicate findings clearly
✔ Present evidence professionally
✔ Recognize methodological limitations
✔ Make logical, data-driven recommendations
The final report included:
- Structured introduction
- Clear methodology
- Clean tables
- Visual figures
- Analytical commentary
- Practical recommendations
This is not just software training.
This is professional capacity building.
Beyond the Assignment
Today it was six respondents.
Tomorrow it could be 6,000.
The skills are the same.
When students can confidently move from raw data to structured evidence, they are ready for roles in:
- Monitoring & Evaluation
- Public health research
- NGO program analysis
- Institutional research units
- Policy advisory teams
A Proud Moment for Cohort #4
This assignment reflects the core philosophy of GapBridge Institute:
We don’t just teach statistics. We build data thinkers.
Congratulations to Cohort #4 for demonstrating that even the smallest dataset can tell a meaningful story — when analyzed with clarity, structure, and professionalism.
If you’re ready to transform numbers into insight, join the next intake in Research, Statistics, and Data Analytics using Stata.
At GapBridge Institute, data becomes decision power.